The aim of this work is to present establishments of the basic model of World Class Manufacturing (WCM) quality management for the production system at Fiat Group Automobiles in order to make products of the highest quality eliminating losses in all the factory fields an improvement of work standards. In fact, World Class Manufacturing is a manufacturing system defined by 6 International companies including Fiat Group Automobiles with the intent to raise their performances and standards to World Class level with the cooperation of leading European and Japanese experts and this includes all the plant processes including quality, maintenance, cost management and logistics etc. from a universal point of view.
Thus, automotive manufacturing requires the ability to manage the product and its associated information across the entire fabricator. Systems must extend beyond their traditional role of product tracking to actively manage the product and its processing. This requires coordinating the information flow between process equipment and higher level systems, supporting both manual and automatic interfaces.
A case study methodology was used to collect detailed information on division and plant strategic objectives, performance measurement systems, and performance measurement system linkages. The result of this research was to develop principles on strategic objectives, performance measurement systems and performance measurement system linkages for improved organizational coordination.
The purpose of this study is to examine the relationship between division and plant performance measurement systems designed to support the firm’s strategic objectives and to improve organizational coordination. We will focus our attention on the Cost Deployment Pillar, Autonomous Activities/Workplace Organization Pillar and Logistics/Customers Service Pillar.
Company Background
Fiat Group Automobiles is an automotive-focused industrial group engaged in designing, manufacturing and selling cars for the mass market under the Fiat, Lancia, Alfa Romeo, Fiat Professional and Abarth brands and luxury cars under the Ferrari and Maserati brands. It also operates in the components sector through Magneti Marelli, Teksid and Fiat Powertrain and in the production systems sector through Comau.
Fiat operates in Europe, North and South America, and Asia. Its headquarters is in Turin, Italy and employs over 137,801 people1. Its 2008 revenues were almost € 59 billion, 3.4% of which were invested in R&D. Fiat’s Research Center (CRF) can be appropriately defined as the “innovation engine” of the Fiat Group, as it is responsible for the applied research and technology development activities of all its controlled companies2.
The group Fiat has a diversified business portfolio, which shields it against demand fluctuations in certain product categories and also enables it to benefit from opportunities available in various divisions.
The aim of the project is to increase the flexibility and productivity in an ETU (Elementary Technology Unit) of Mechanical Subgroups in a part of the FGA’s assembling process in the Cassino Plant through the conventional Plan-Do-Check-Act approach using the WCM methodology:
Statement of the Problem and PDCA methodology
- PLAN – Costs Analysis and Losses Analysis starting from Cost Deployment (CD) for the manufacturing process using the items and tools of Workplace Organization (WO) and for the handling process the Logistic and Customer Services (LOG) applications.
- DO – Analysis of the non-value-added Activities; analysis of re-balancing line and analysis of re-balancing of work activities in accordance with the analysis of the logistics flows using the material matrix and the flows matrix. Study and realization of prototypes to improve workstation ergonomics and to ensure minimum material handling; Application of countermeasures found in the production process and logistics (handling).
- CHECK – Analysis of results in order to verify productivity improvement, ergonomic improvement (WO) and the optimization of the internal handling (in the plant) and external logistics flows (LOG). Check of the losses reduction according to Cost Deployment (CD).
- ACT – Extension of the methodology and other cases.
Here below is a description of the Statement of the Problem and PDCA methodology.
PLAN: COSTS ANALYSIS AND LOSSES ANALYSIS (CD) FOR THE MANUFACTURING PROCESS (WO) AND FOR THE HANDLING PROCESS (LOG)
In this first part (PLAN) were analyzed the losses in the assembly process area so as to organize the activities to reduce the losses identified in the second part of the analysis (DO). Object of the study was the Mechanical Subgroups ETU – Elementary Technology Unit (in a part of the Cassino Plant Assembly Shop). The aim of this analysis was to identify a program allowing to generate savings policies based on Cost Deployment:
Identify relationships between cost factors, processes generating costs and various types of waste and losses;
Find relationships between waste and losses and their reductions.
In fact, in general a production system is characterized by several waste and losses (MUDA), such as:
- Non-value-added activities;
- Low balancing levels;
- Handling losses;
- Delay in material procurement;
- Defects;
- Troubleshooting Machines;
- Setup;
- Breakdown.
It is important to give a measure of all the losses identified in process examination. The data collection is therefore the “key element” for the development of activities of Cost Deployment. Here below in Figure 1.7 an example of losses identified from CD from the Assembly Shop is shown and in Figure 1.8 is shown an example of CD data collection regarding NVAA (Non-Value-Added Activities) for WO (for this case study we excluded check and rework losses) in the Mechanical Subgroups area. Finally Figure 1.9 shows Analysis of losses Cost Deployment.
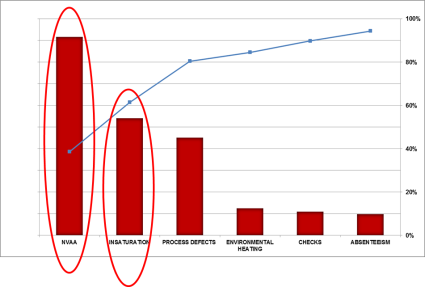
Figure 1.7 Analysis of losses Cost Deployment – Stratification of NVAA losses for Mechanical Subgroups ETU – Elementary Technology Unit (figure highlights the most critical workstation)
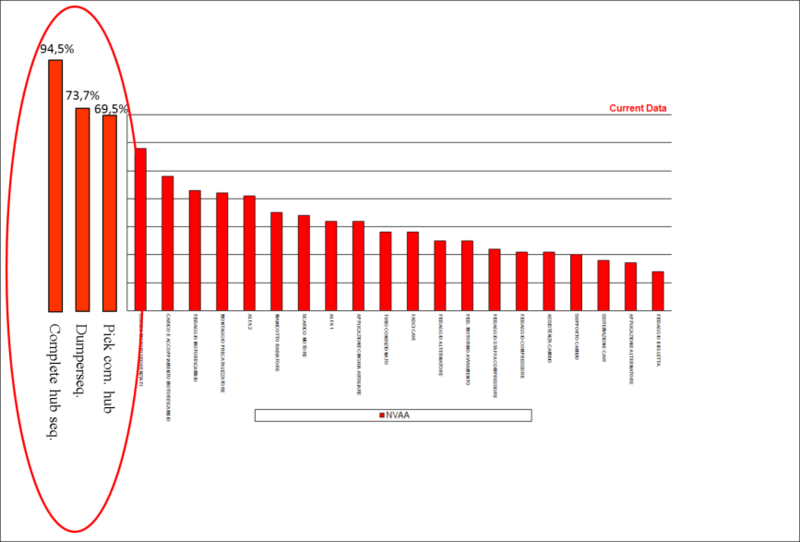
Figure 1.8 Analysis of losses Cost Deployment – Pareto Analysis NVAA Mechanical Subgroups ETU – Elementary Technology Unit
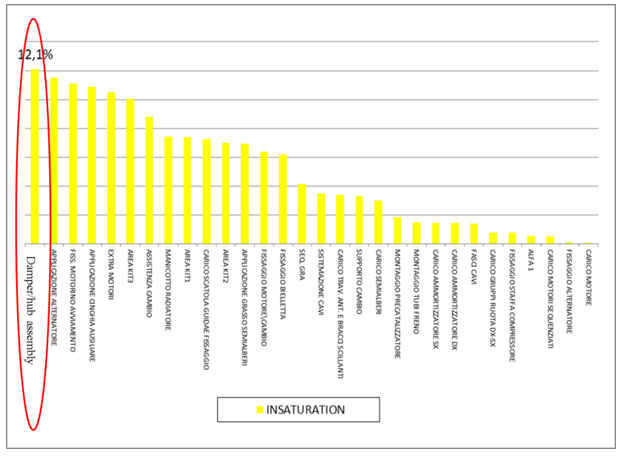
Figure 1.9 Analysis of losses Cost Deployment – Pareto Analysis Line Balancing Losses or Insaturation on Mechanical Subgroups ETU – Elementary Technology Unit
DO – ANALYSIS OF NON-VALUE-ADDED ACTIVITIES, OF THE RE-BALANCING LINE AND ANALYSIS OF RE-BALANCING OF WORK ACTIVITIES
According to Figure 1.9 and Figure 1.10 were analyzed the losses regarding NVAA and Insaturation. In fact were analyzed all 4 critical workstations (because they have the worst losses) and were identified 41 types of non-value-added activities (walking, waiting, turning, picking….) in the various sub-phases of the production process. In Table 1.4 is shown some examples of non-value-added activities analyzed (MUDA Analysis).
Some examples of standard tools used to analyze NVAA reduction (MUDA Analysis) for the 4 workstations are shown here below in Figure 1.10, Figure 1.11 and Figure 1.12) job stratification (VAA – Value Added Activities; NVAA – Non-Value-Added Activities; LBL – Low Balancing Level; EAWS – European Assembly Work Sheet – Ergonomy); 2) Spaghetti Chart and 3) Kaizen Standard.
Table 1.4 MUDA Analysis – NVAA
| N° | Losses identified | Solution | Non-value-added activities identified | Pictogram |
| 1 | Pick picking list for sequencing | Complete hub sequencing | To pick |  |
| 2 | Pick the box for sequencing | Complete hub sequencing | To pick | |
| 3 | Select sheets for the different model | Unification of the sheets from 3 to 1 | To select |  |
| 4 | Pick sheets for the different process | Unification of the sheets from 3 to 1 | To pick | |
| 5 | Pick identification sheet | Unification of the sheets from 3 to 1 | To pick | |
| 6 | Go to the printer to pick up sticker | Print sticker | To walk |  |
| 7 | Pick identification hub label | Digital label with barcode | To pick | |
| 8 | Throw liner nameplate into the waste container | Print labels directly onto sheet unified | To trow |  |
| 9 | Pick equipment for reading labels coupling | Automatic reading | To pick | |
| 10 | Combination of manual pallet | Automatic combination | To check |  |
| 11 | Use of a single box | Enabling a second workstation | To walk | |
| 12 | Pick hub | Pick subgroup (hub+ damper | To pick | |
| 13 | Use of electrical equipment through keyboard | New air equipment without keyboard | To arrange |  |
| 14 | Use of air equipment through keyboard | New air equipment without keyboard | To wait |  |
| 15 | Transport empty box hub sequencing to put the full box | Complete hub sequencing | To transport | |
| 16 | Walk to the line side to pick damper | Complete hub sequencing | To walk | |
| 17 | Remove the small parts to pair with damper | Complete hub sequencing | To pick | |
| 18 | Transport empty box damper sequencing to put the full box | Complete damper sequencing | To transport | |
| 19 | Pick the hub and put on the line | Pick subgroup (hub+ damper) | To pick | |
| 20 | Select the work program for the next workstation | Select the work program | To select | |
| 21 | Press the feed button for the damper | Use a single workstation after the sequencing of the subgroup in order to press a button once | To push |  |
| 22 | Wait for the translational motion of the pallet | Use a single workstation after the sequencing of the subgroup and match processing activities during the translation of the pallet | To wait | |
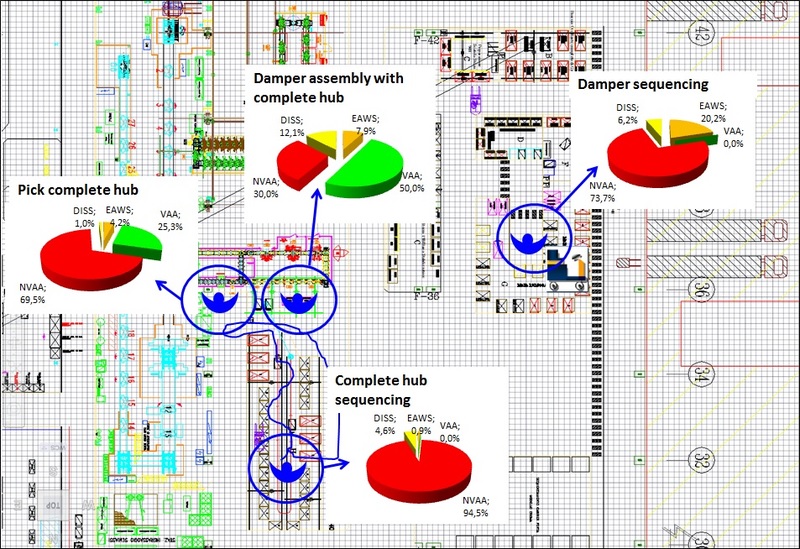
Figure 1.10 Details of the 4 workstations
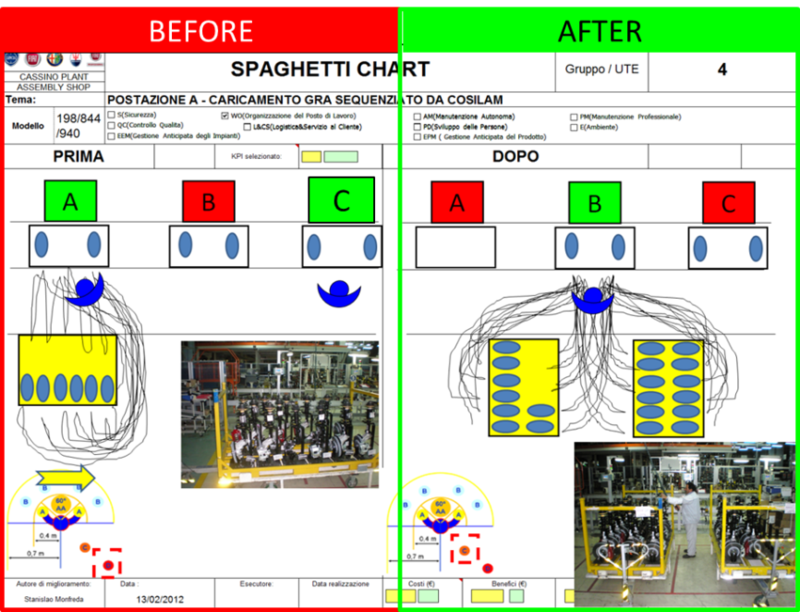
Figure 1.11 Spaghetti Chart Example
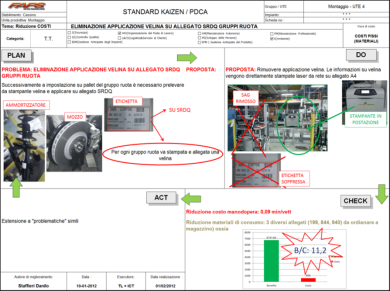
Figure 1.12 Standard Kaizen analysis Example
Figure 1.13 shows the initial scenario analyzed to identify problems and weaknesses.
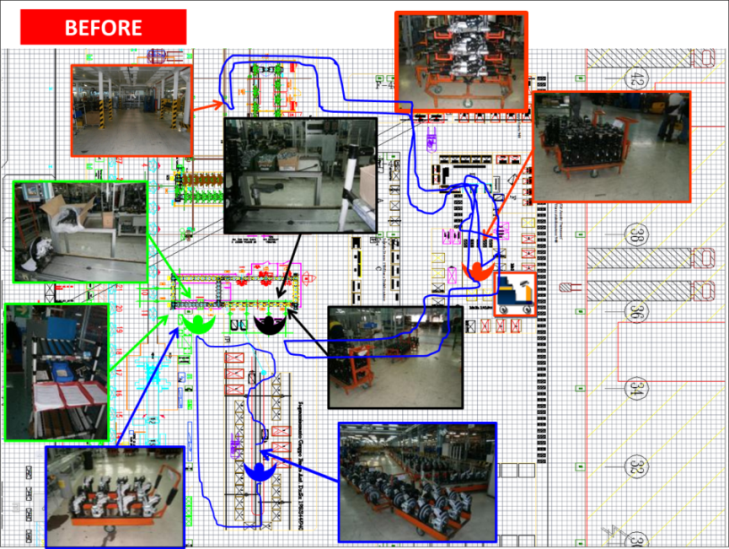
At this point was assumed the new flow of the complete damper (corner) = damper + complete hub sequencing according to the material matrix considering losses relating to handling (material matrix classification – see Figure 1.14).
The material matrix classifies the commodities (number of drawings) in three main groups: A (bulky, multi-variations, expensive), B (normal) and C (small parts) and subgroups (a mixture of group A: bulky and multi-variations or bulky and expensive etc.).
For each of these groups was filled out the flow matrix that defines the correct flow associated: JIS (and different levels), JIT (and different levels) and indirect (and different levels). After identifying the correct flow, in the JIS case, was built a prototype of the box (bin) to feed the line that would ensure the right number of parts to optimize logistic handling.
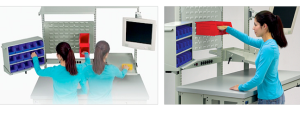
However, the new box (bin) for this new mechanical subgroup must feed the line in a comfortable and ergonomic manner for the worker in the workstation, for this reason was simulated the solution before the realization of the box (bin) (see Figure 1.15).
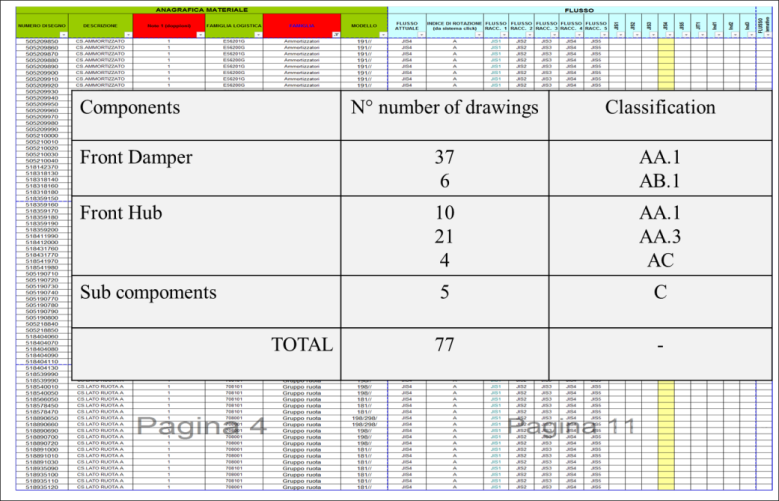
Figure 1.14 Material matrix example
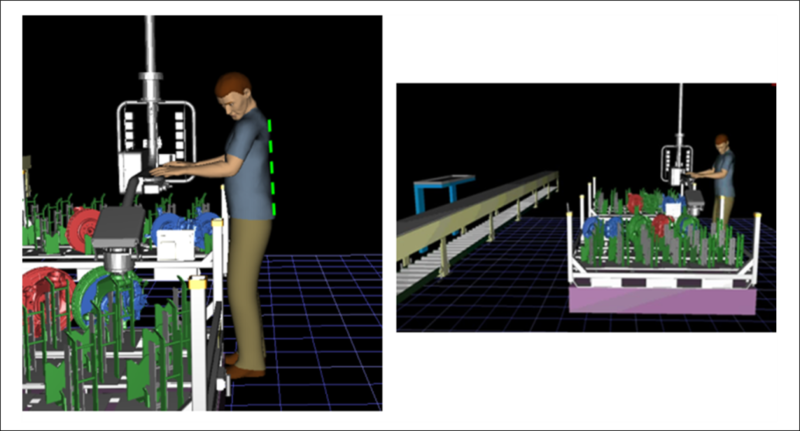
Figure 1.15 Simulation of an ergonomic workstation
At the end of the Muda analysis (NVAA analysis) were applied all the solutions found to have a lean process (the internal target is to achieve 25% of average NVAA losses) and was reorganized the line through a new line balancing level (rebalancing) to achieve 5% of the average line balancing losses (internal target).
Another important aspect was the logistics flows analysis (see Figure 1.16) considering advanced warehouses ( Figure 1.17). The simulation scenario was defined using trucks from the Cassino plant warehouses that also feed other commodities to achieve high levels of saturation to minimize handling losses.
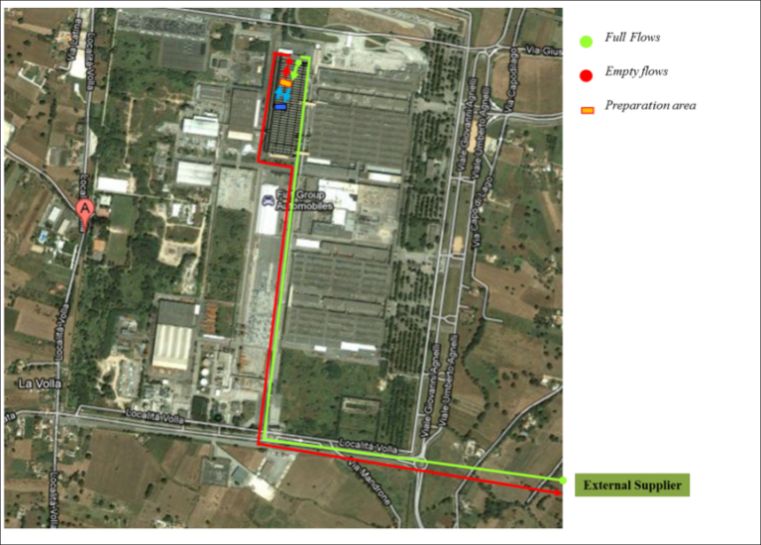
Figure 1.16 Initial logistic flows
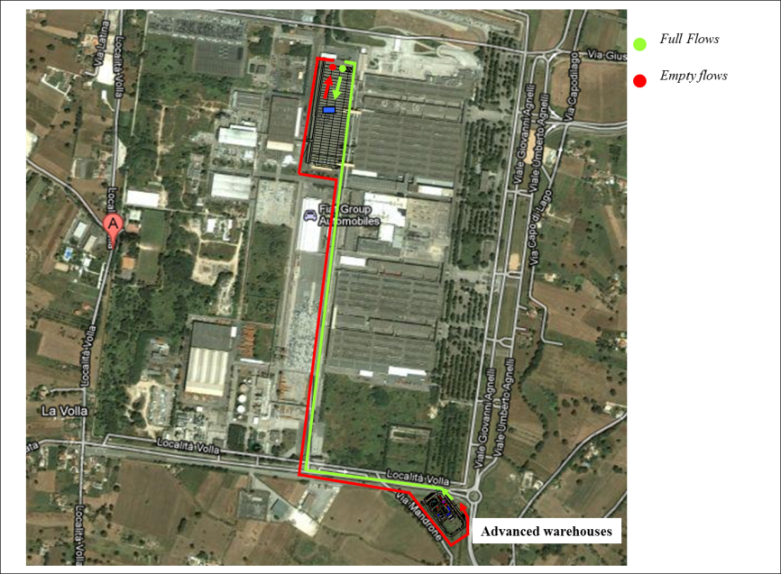
Figure 1.17 Logistic flows considering advanced warehouses
At the end of the handling analysis (flow, stock level…) thanks to this new “lean” organization of material matrix was used the correct line feed from the Just In Sequence warehouse. It was reduced the internal warehouse (stock level), the space used for sequencing (square metres), the indirect manpower used to feed the sequencing area and we obtained zero forklifts on the shopfloor because we used the ro-ro (roll in – roll out) system. Figure 1.18 shows the final scenario in which we have 1 operator instead of 4 operators.
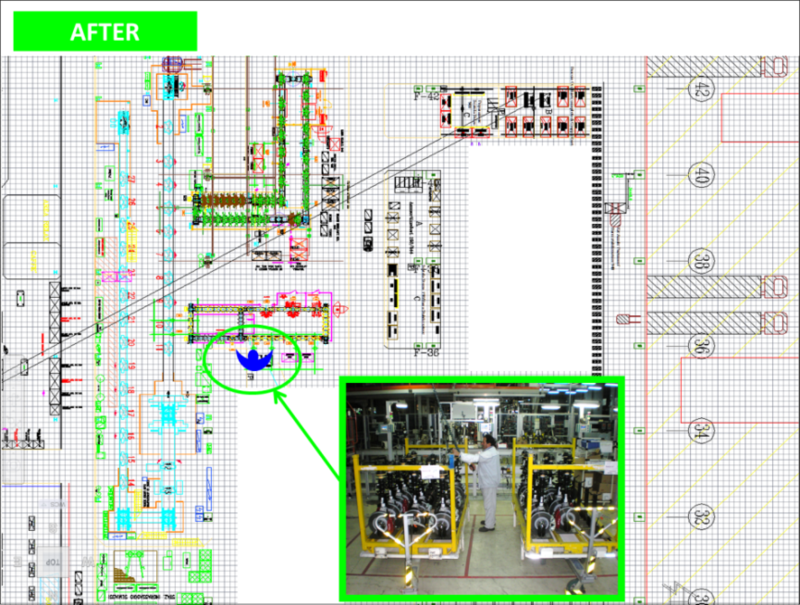
Figure 1.18 Details of the final workstation
CHECK – ANALYSIS OF RESULTS TO VERIFY PRODUCTIVITY AND ERGONOMIC IMPROVEMENT AND OPTIMIZATION OF LOGISTICS FLOWS
In detail the main results and savings can be summarized as follows:
- Productivity improvement +75% ( Figure 1.19) direct labour;
- Ergonomics improvement +85% ( Figure 1.20) according to the rest factor;
- Optimization of logistic flows ( Figure 1.21) according to the flow matrix.
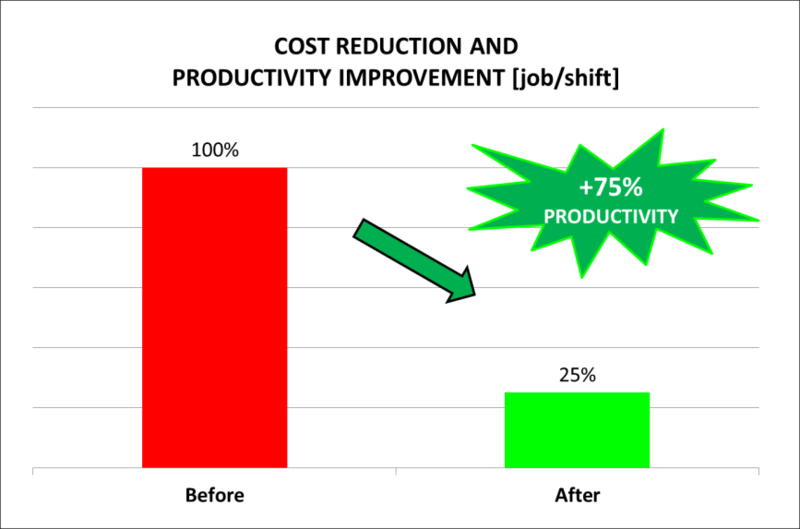
Figure 1.19 Productivity optimization
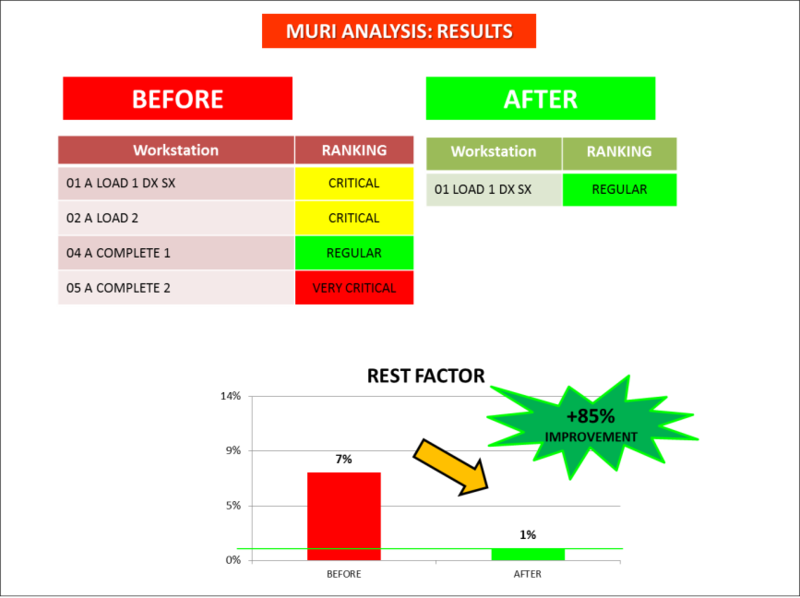
Figure 1.20 Ergonomics improvement
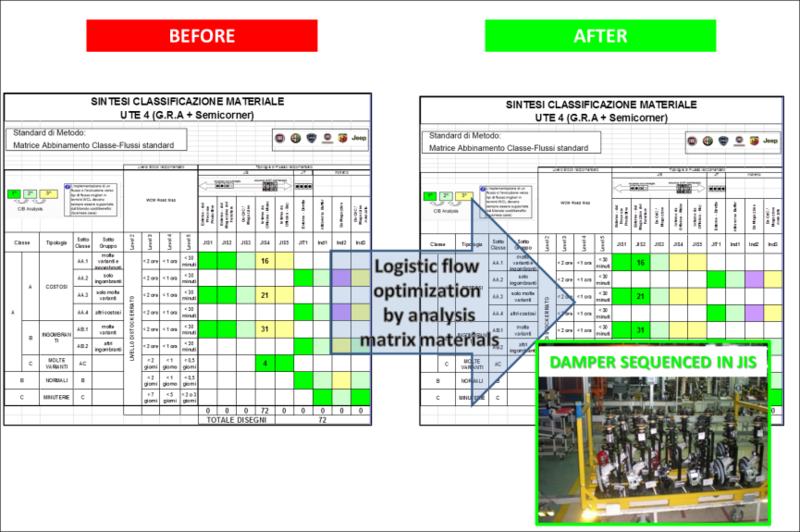
Figure 1.21 Optimization of logistic flows
ACT – EXTENSION OF THE METHODOLOGY AND OTHER CASES
Future developments include the extension of the methodology to the entire plant. Here below in Table 1.5 we can see the activities and status adopted. to achieve the results shown in the “check”. We used traditional tools and methodology for the analysis and new tools to simulate the sceneries on the line and for the logistic problems we involved other resources outside the plant (ELASIS and CRF – FIAT Research Center, Fiat Central Department and Public Universities).
|
ACTIVITIES |
TOOL |
STATUS |
|---|---|---|
|
NVAA Reduction |
NVAA Std analysis |
+ |
|
LBL Reduction |
Balance line |
+ |
|
Ergonomics Improvement |
Jack Software |
+ |
|
Optimization of logistics flow |
Value stream map |
+ |