Also Called: Cause and Effect Diagram.
A fishbone diagram helps team members visually diagram a problem or condition’s root causes, allowing them to truly diagnose the problem rather than focusing on symptoms. It allows team members to separate a problem’s content from its history, and allows for team consensus around the problem and its causes.
How to Construct a Fishbone Diagram
1. Problem Statement
Draft a clear problem statement, on which all team members agree. Be specific about how and when the problem occurs.
Write the problem statement on the right side of your paper, at the head of the “fish.” Your team will work out and away from this problem. Draw a line with an arrow toward the head of the fish this is the fish’s “backbone.”

2. Categorization
Brainstorm major categories of your process or procedure . Connect them to the backbone, in “ribs.”
There is no specific number of steps or categories you might need to describe the problem; some common categories are listed below.

3. Contributing Factors
Brainstorm possible problem causes, and attach each to the appropriate rib. Your team might find it helpful to place ideas on category ribs as they are generated, or to brainstorm an entire list of ideas and then place them on ribs all at once.
Ideally, each contributing factor would fit neatly into a single category, but some causes may seem to fit into multiple categories. If you have a contributing factor that fits into more than one category, place it in each location, and see whether, in the end, considering that factor from multiple points of view has made a difference.

4. Ask: Why?
As you list a factor, repeatedly ask your team why that factor is present:
Why does staff lack expertise? (Because we don’t attend training.)
Why don’t we attend training?(Because we don’t have the funding.)
Why don’t we have the funding? (Because we haven’t applied for grants.)
Why don’t we apply for grants? (Because we’re unaware of sources.)
Etc.
Sometimes this asking process is called the “Five Whys,” as five is often a manageable number to reach a suitable root cause.
Your team may need more or less than five whys. (More Information: Five Whys .)
5. Many Ribs: Deeper Causes
You may end up with multiple branches off of each successively smaller rib. Your team
might lack expertise, for example, because of a lack of training, but also because you didn’t hire the right people for the job. Treat each contributing factor as its own “minirib,” and keep asking why each factor is occurring.
Continue to push deeper for a clear understanding. While you could likely brainstorm all day, however, it is important to know whento stop to avoid frustration. A good rule of thumb: When a cause is controlled by more than one level of management, remove it
from the group.

6. Test for Root Causes
Test for root causes by looking for causes that appear repeatedly within categories or across major categories.
Hint: Usecheck sheets to determine the frequencies of various causes, and scatter plots
to test the strength of cause effect correlation.
[wpdm_tree category=”ishikawa-fishbone-diagram”]
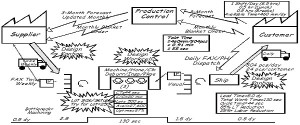
Example Fishbone Diagram